The GAD-7 measures anxiety severity against DSM criteria for generalised anxiety disorder. In Flutura, you can assign it from your library, let clients complete it in their own time, and track scores across treatment using clinical interpretation and trend charts. This guide covers the full workflow, from library to long-term review.
You'll need:
A client profile already created
The client's consent to complete outcome measures
The GAD-7 and PHQ-9 sit together under Clinical Metrics, so you can track both from one place.
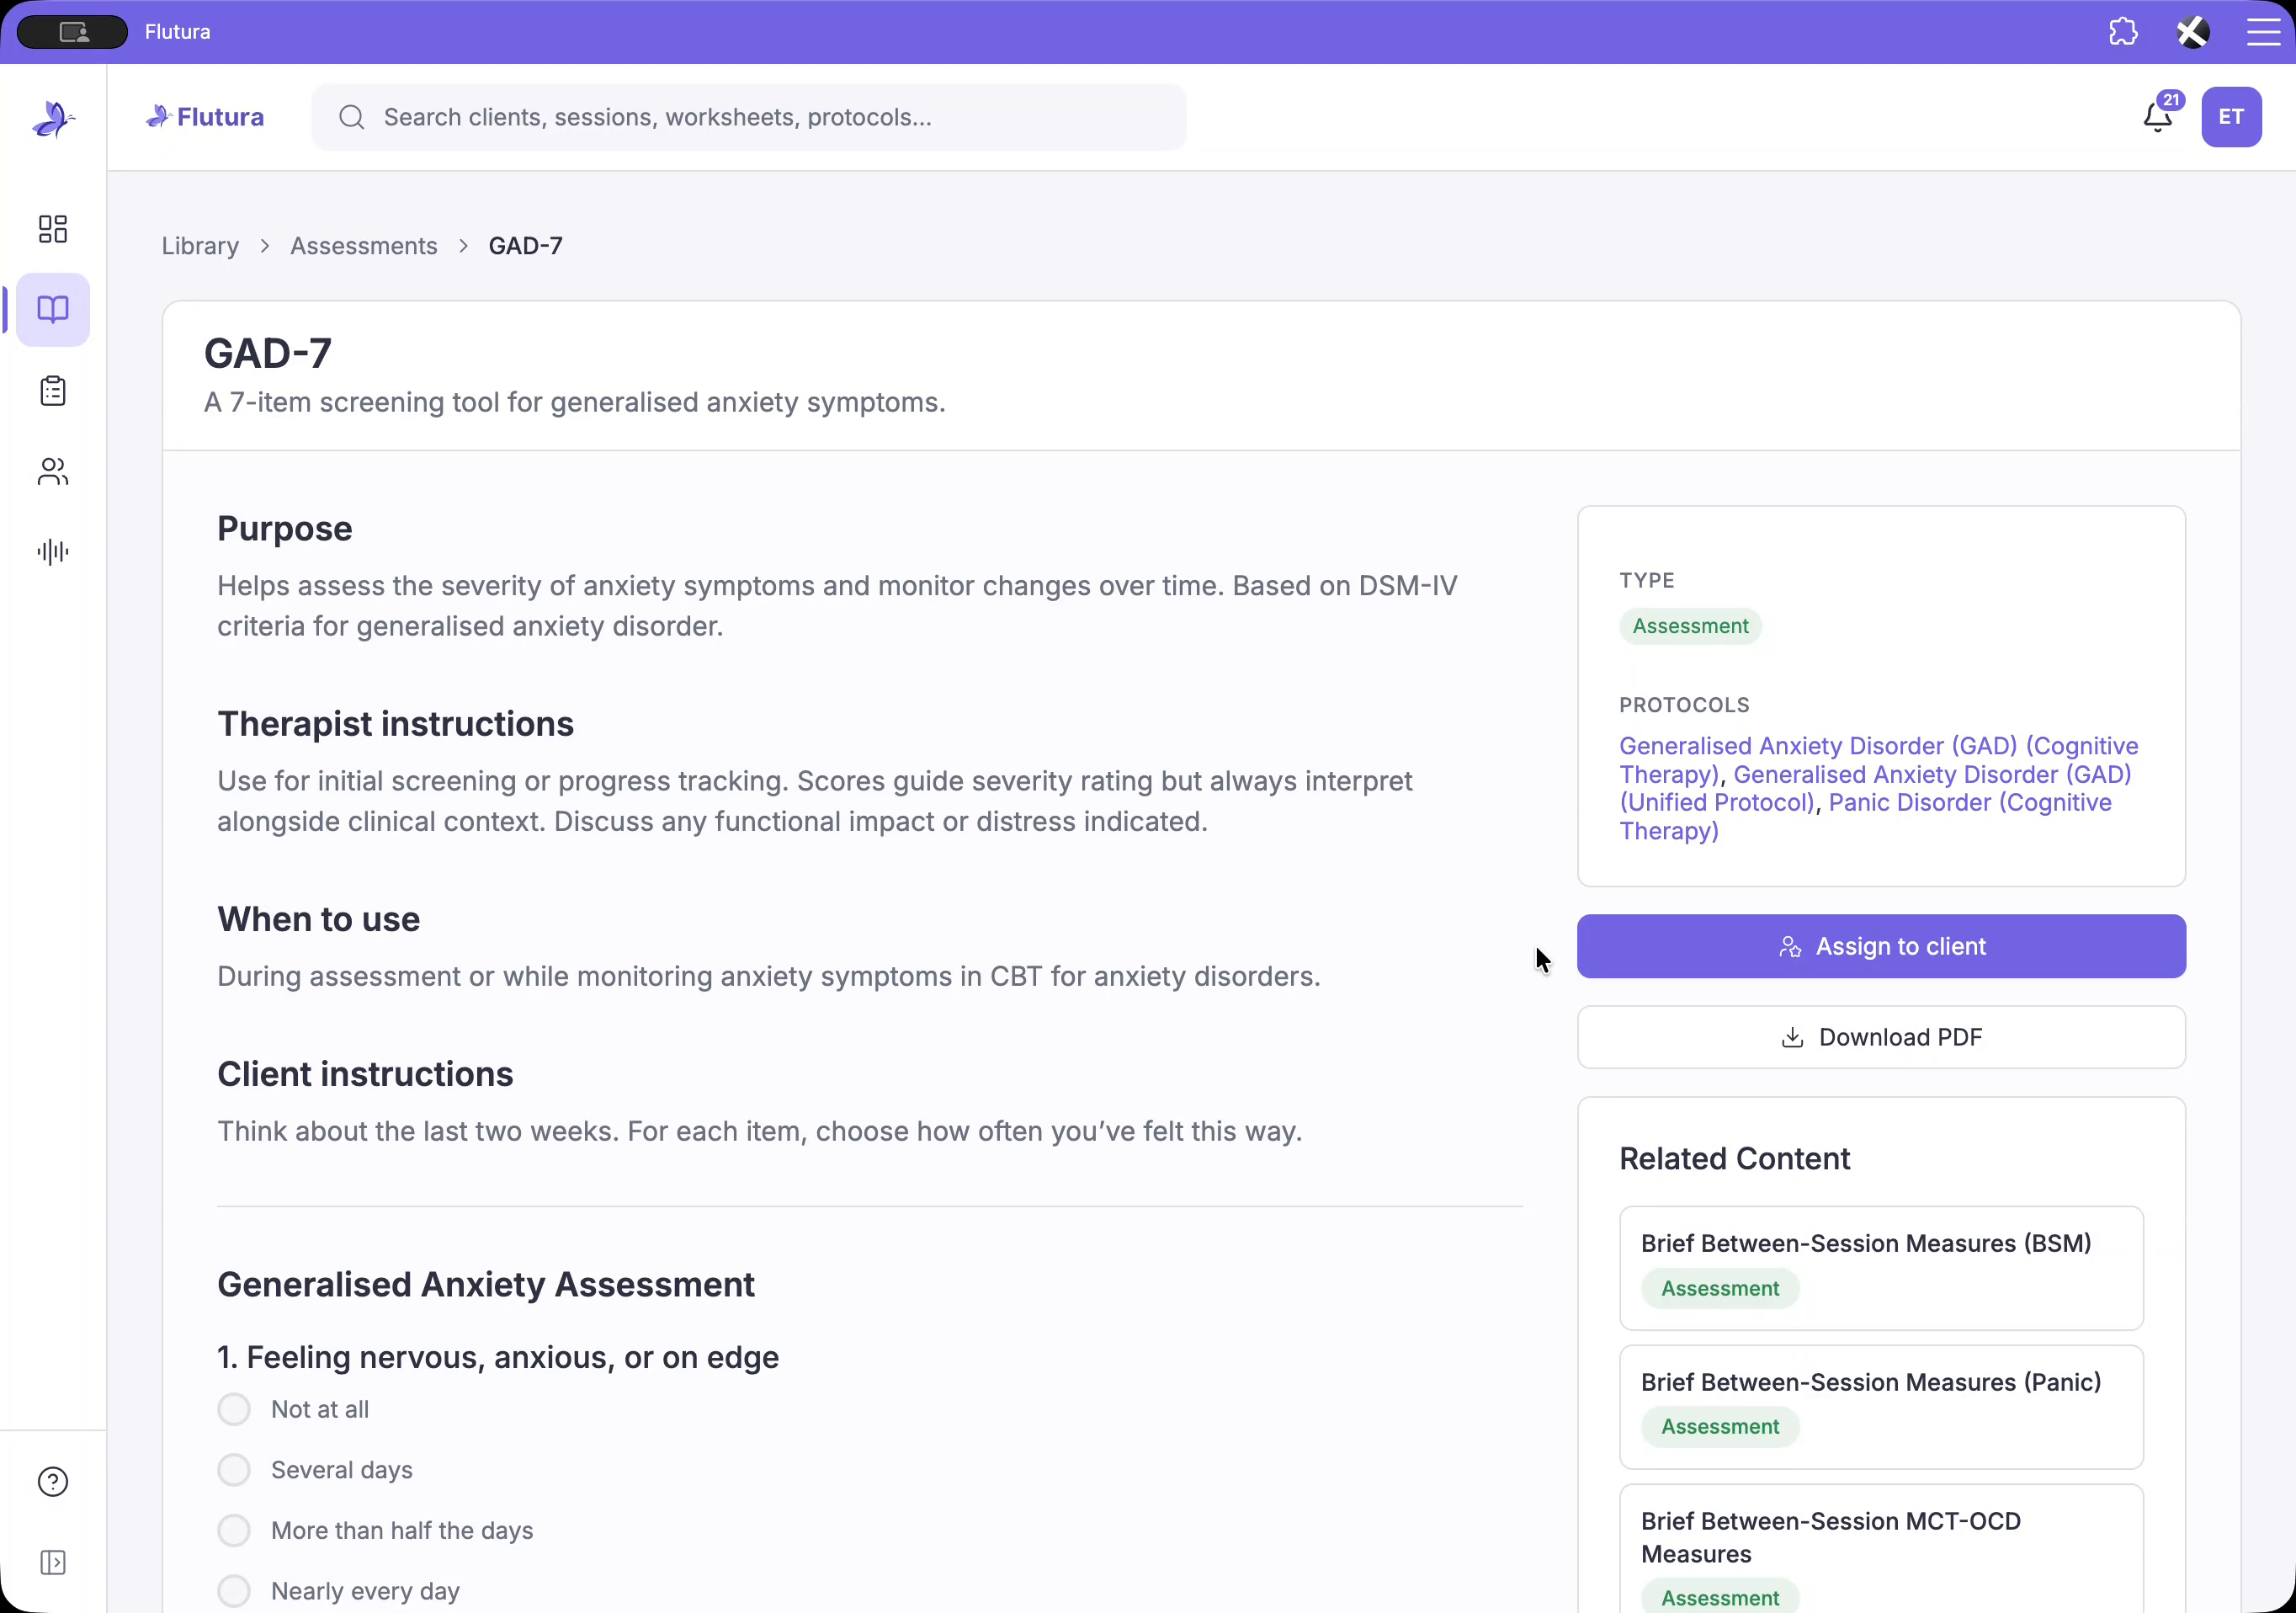
Open the GAD-7 in your Flutura library to read the full detail before assigning it to a client.
The Purpose section confirms that this scale measures anxiety severity, based on DSM criteria for generalised anxiety disorder. Therapist instructions cover how to use the measure for initial screening and for progress tracking. Let the scores inform your severity rating, but interpret them alongside clinical context and the functional impact your client reports.
Just below, the When to use and Client instructions sections explain when to use the GAD-7 and how your client will experience the questionnaire. You can also read all seven items exactly as your clients will see them.
On the right of the protocol page, you can view linked protocols and related measures, assign the assessment to a client, or download a PDF to use offline.
When you are ready to send the assessment, select Assign to client.
Search for your client by name or select them from the list.
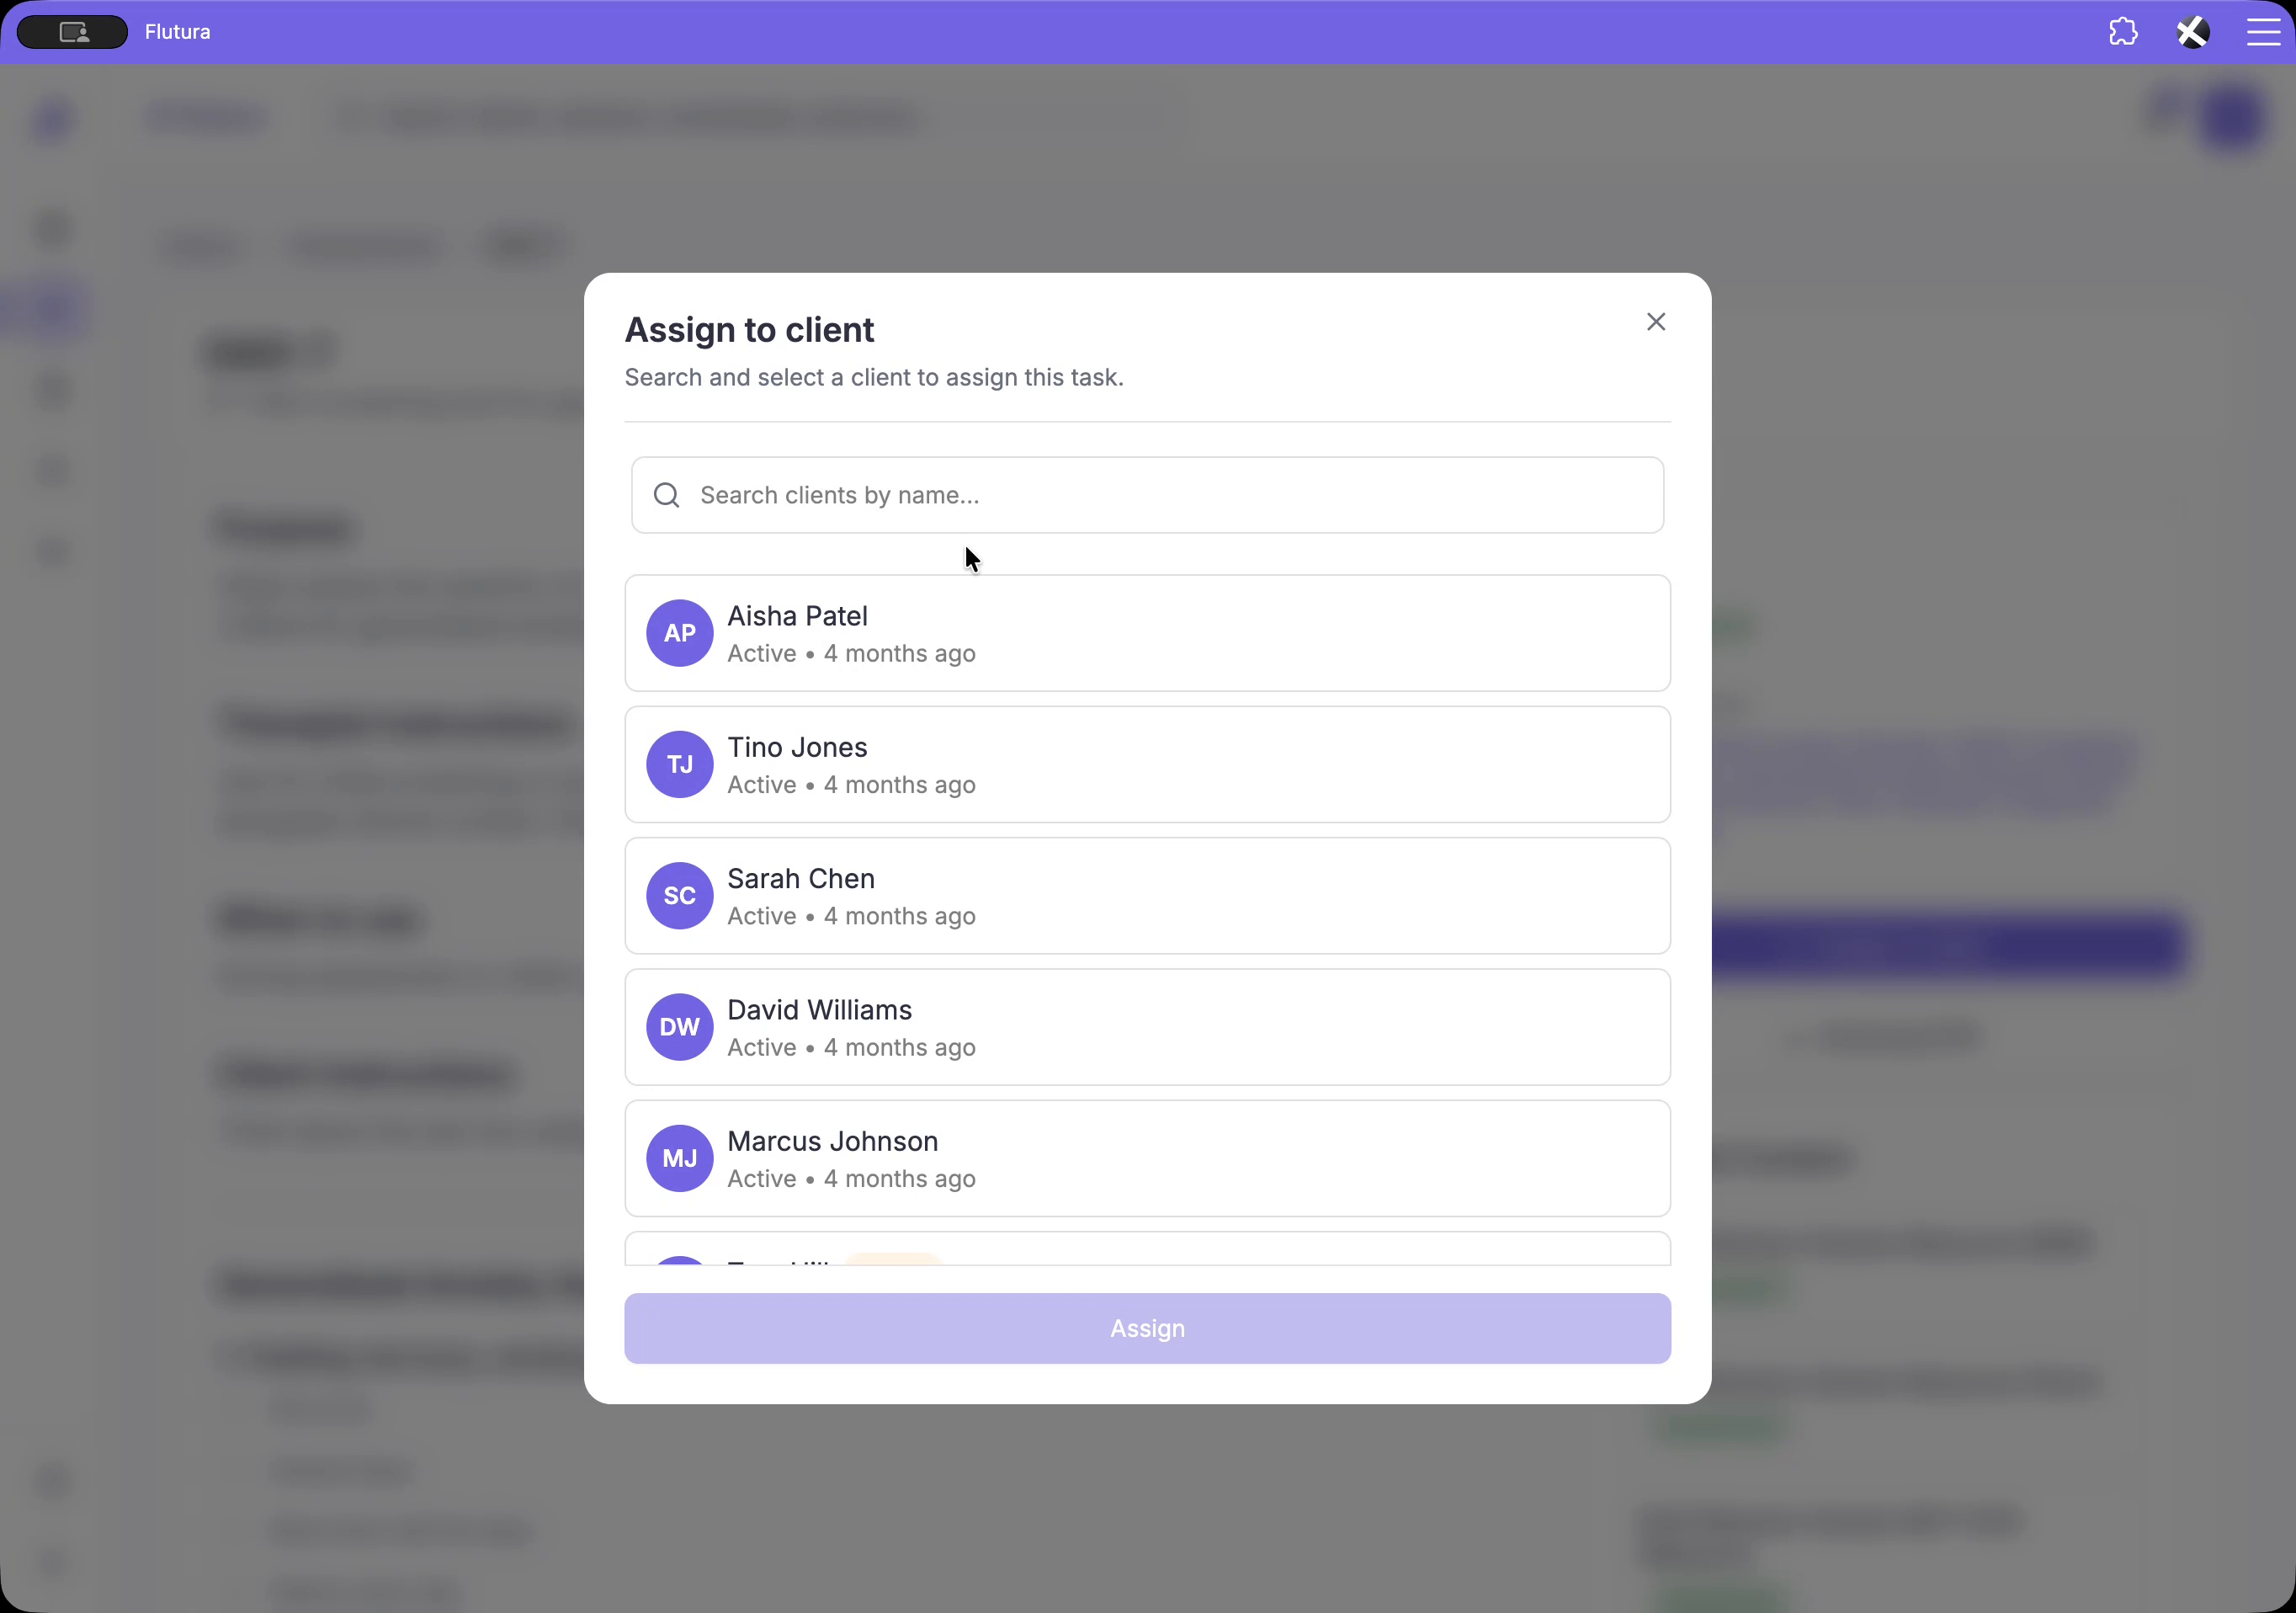
Select Assign to continue.
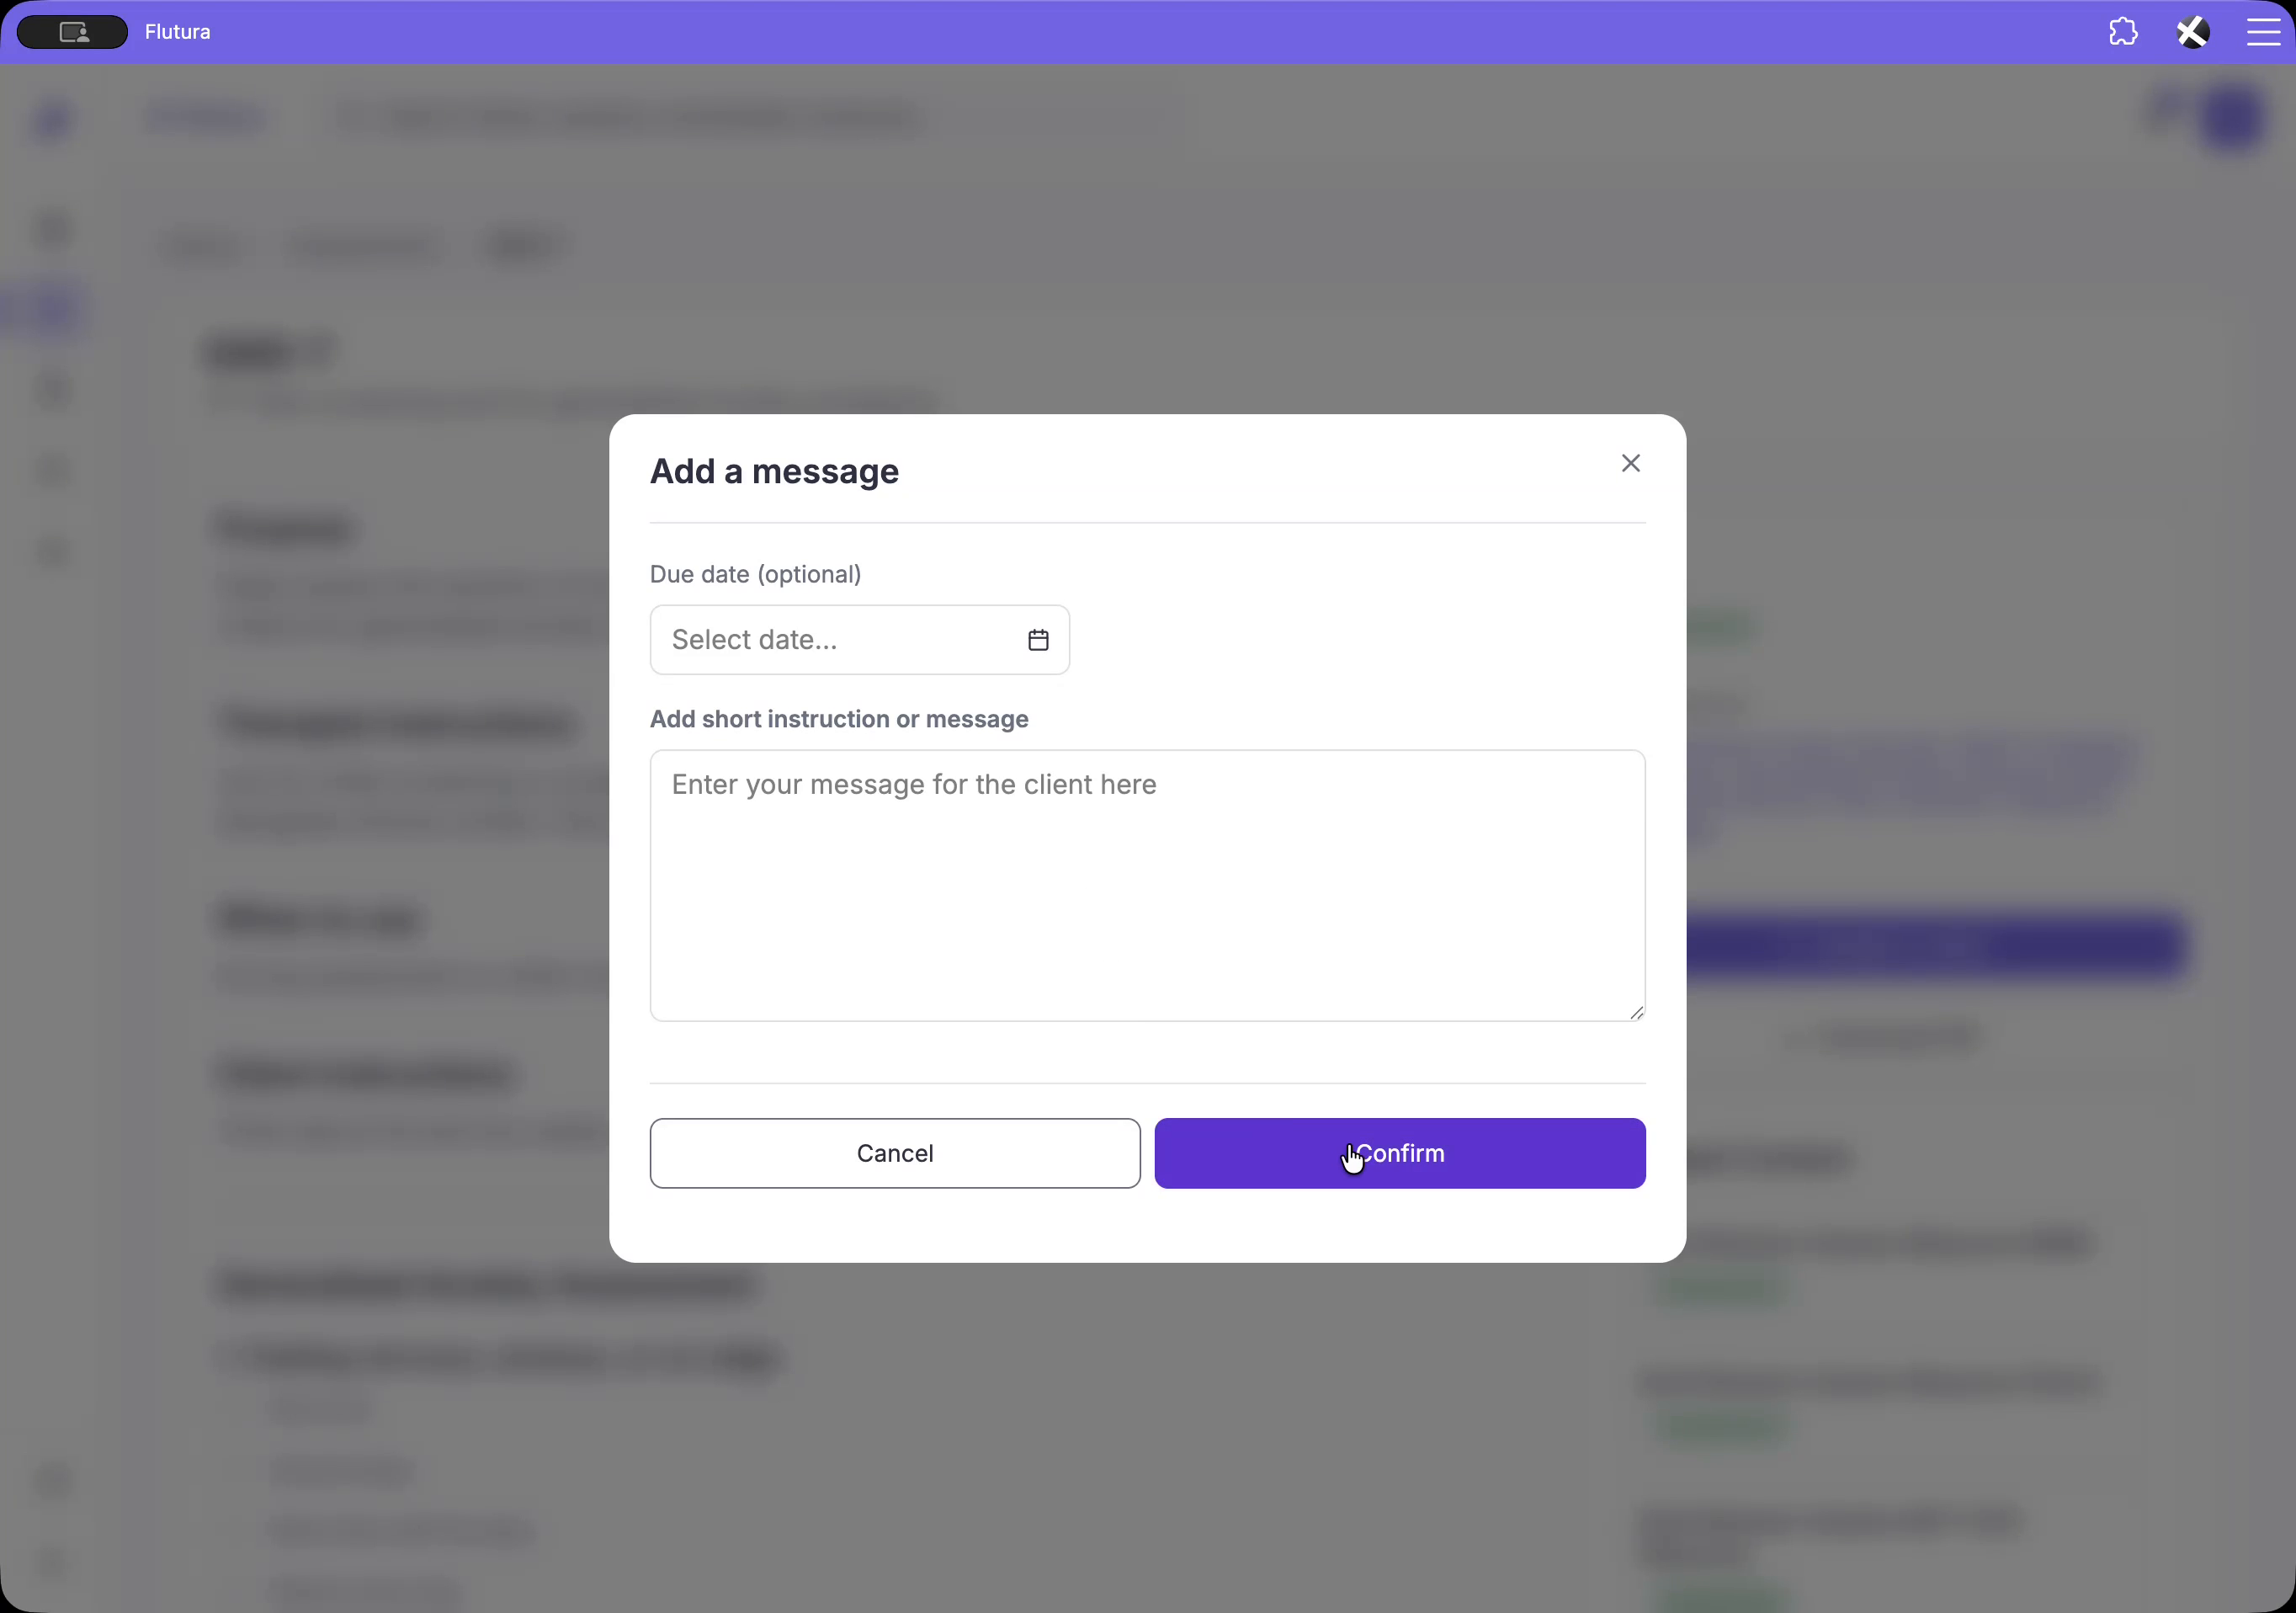
Set an optional due date and a short message to give your client context, or leave both fields blank to keep the task open-ended. Select Confirm to send the assessment. It appears immediately in the client's task list, and they can complete it whenever suits them.
Once the client submits the GAD-7, their score saves automatically to their profile under Clinical Metrics, alongside the PHQ-9.
The GAD-7 card shows:
The latest score and severity band (for example, Minimal)
A trend label indicating whether the score is rising, falling, or stable
A chart below plots every administration over time, so you can see how scores change as treatment progresses (for example, a score falling from 16 to 4 since April). Hover over any point on the chart to view the detail for that administration. This gives you the treatment arc at a glance before you go into session.
The GAD-7 card offers two main actions:
Assign GAD-7: sends a new administration, letting you build a trend line by readministering at review points
View GAD-7: opens the most recent completed result for that client
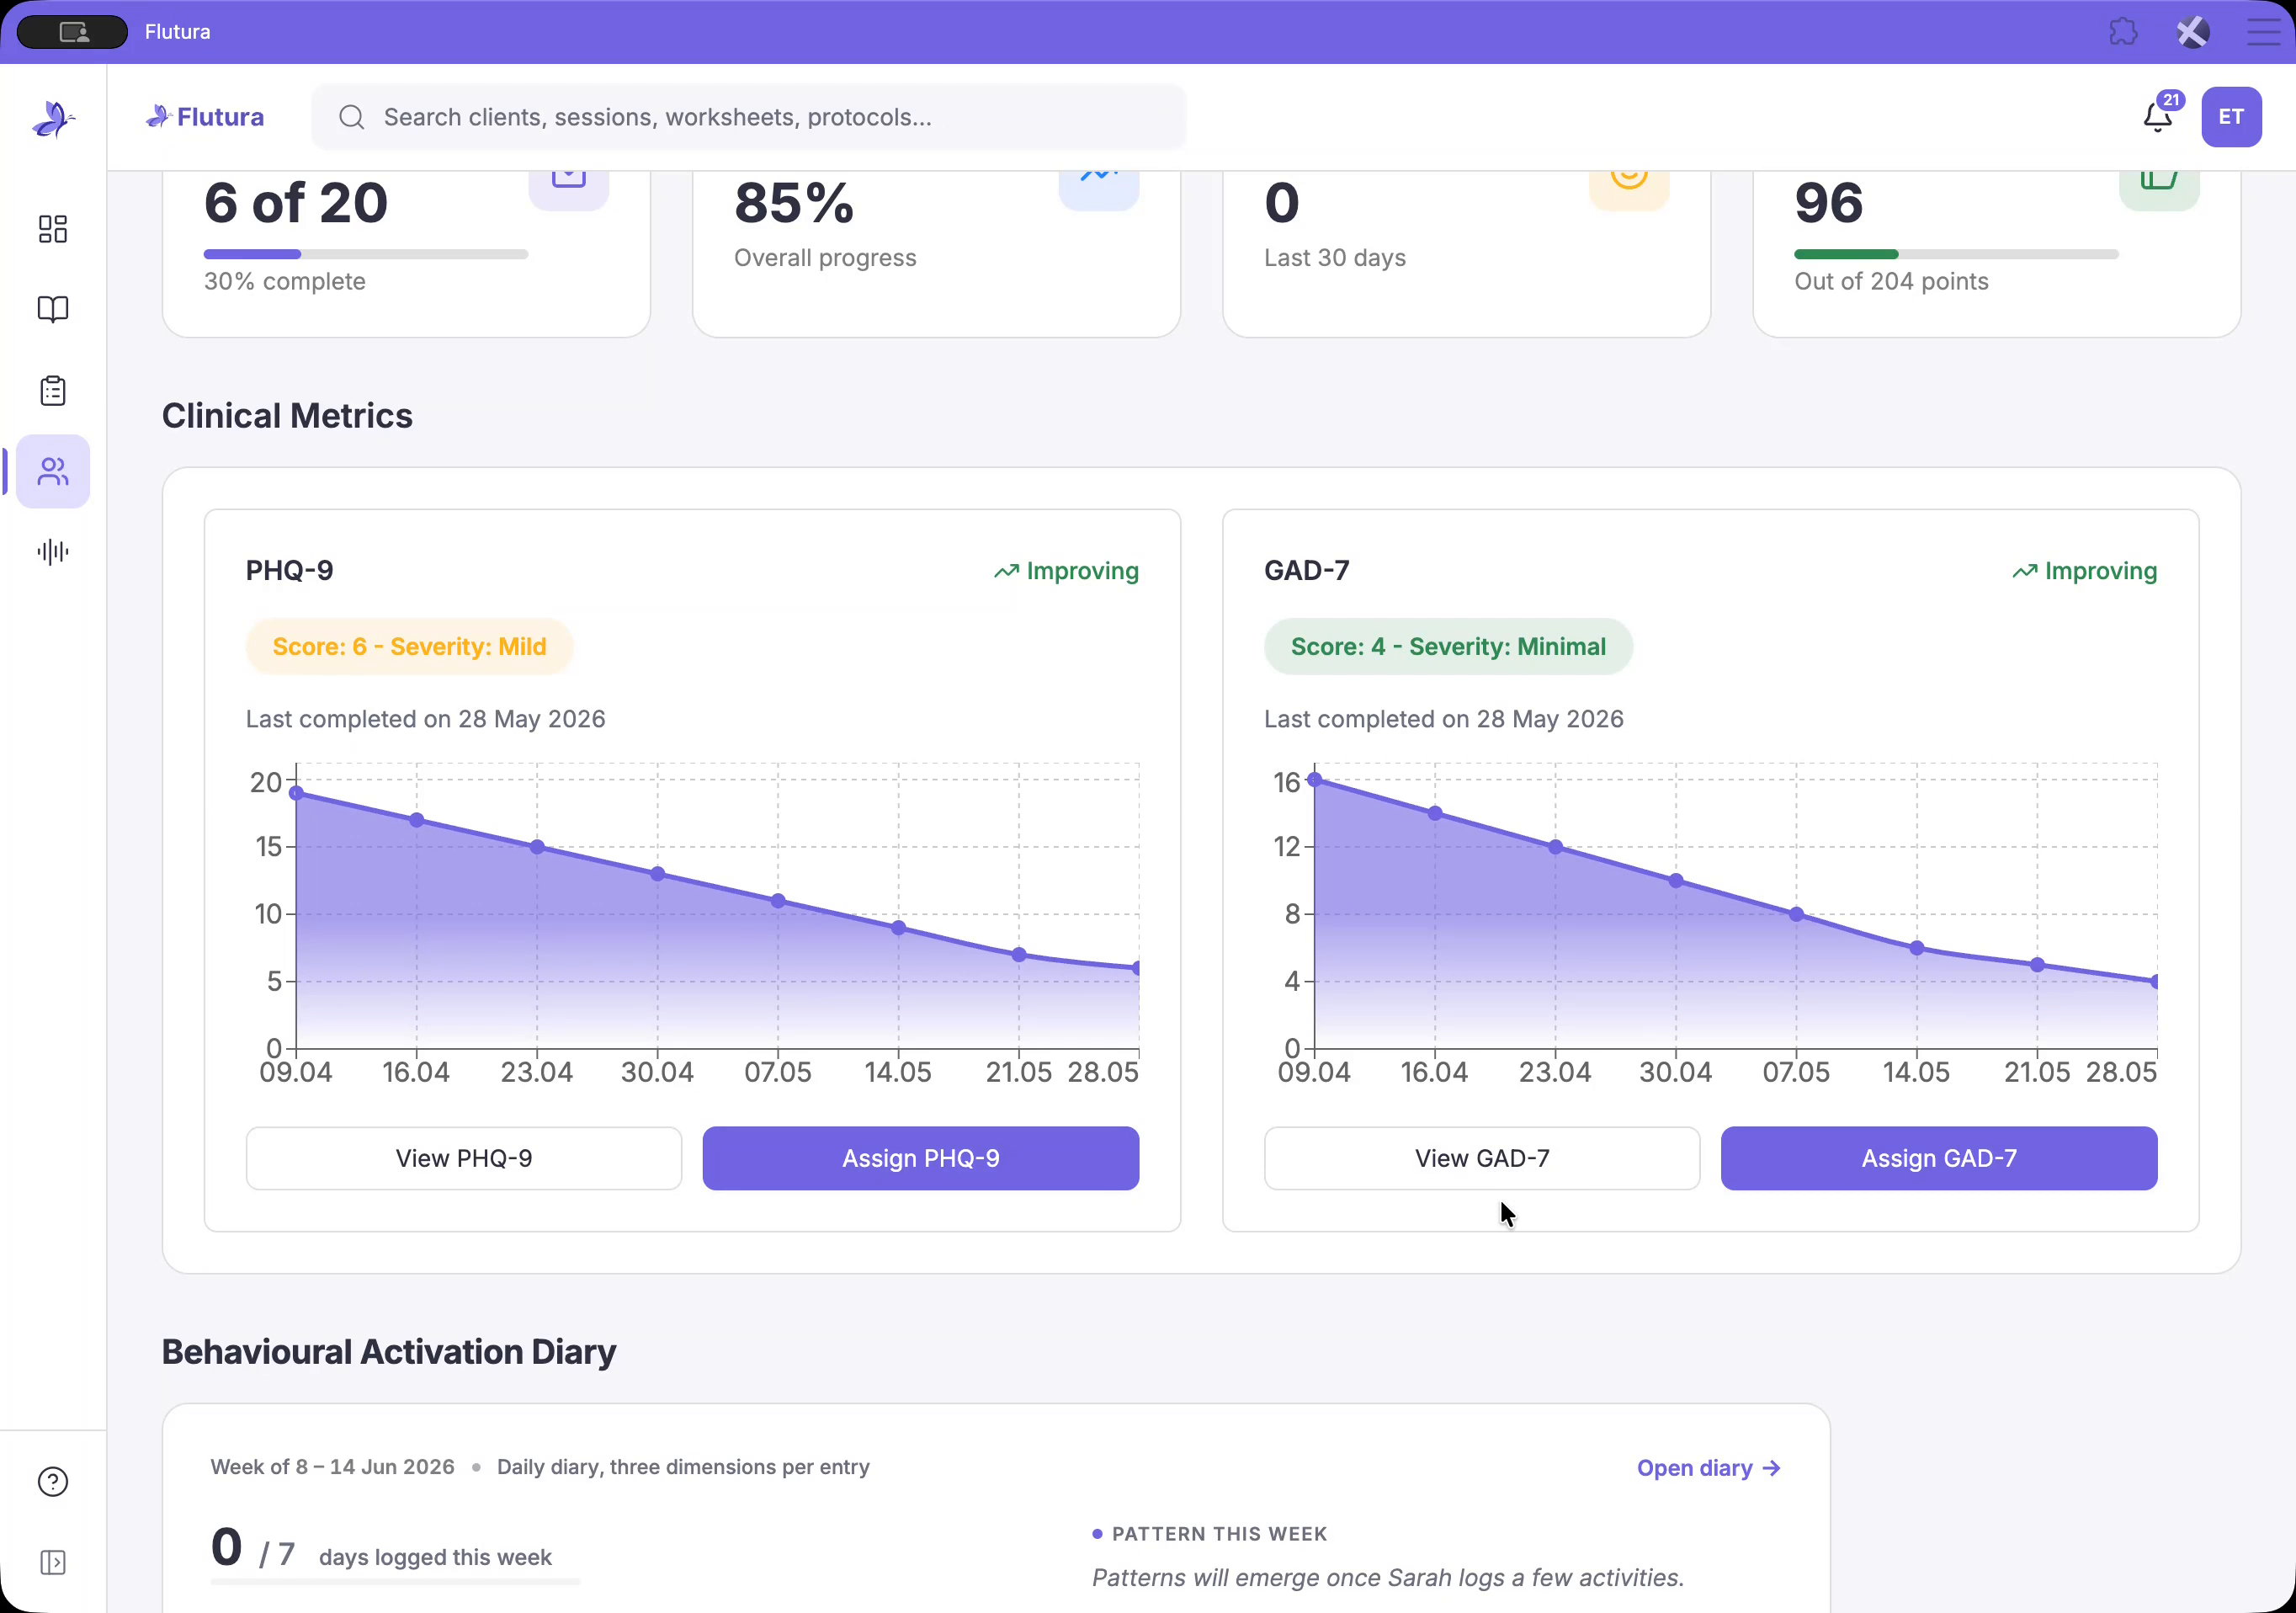
Select View GAD-7 to open the most recent completed assessment.
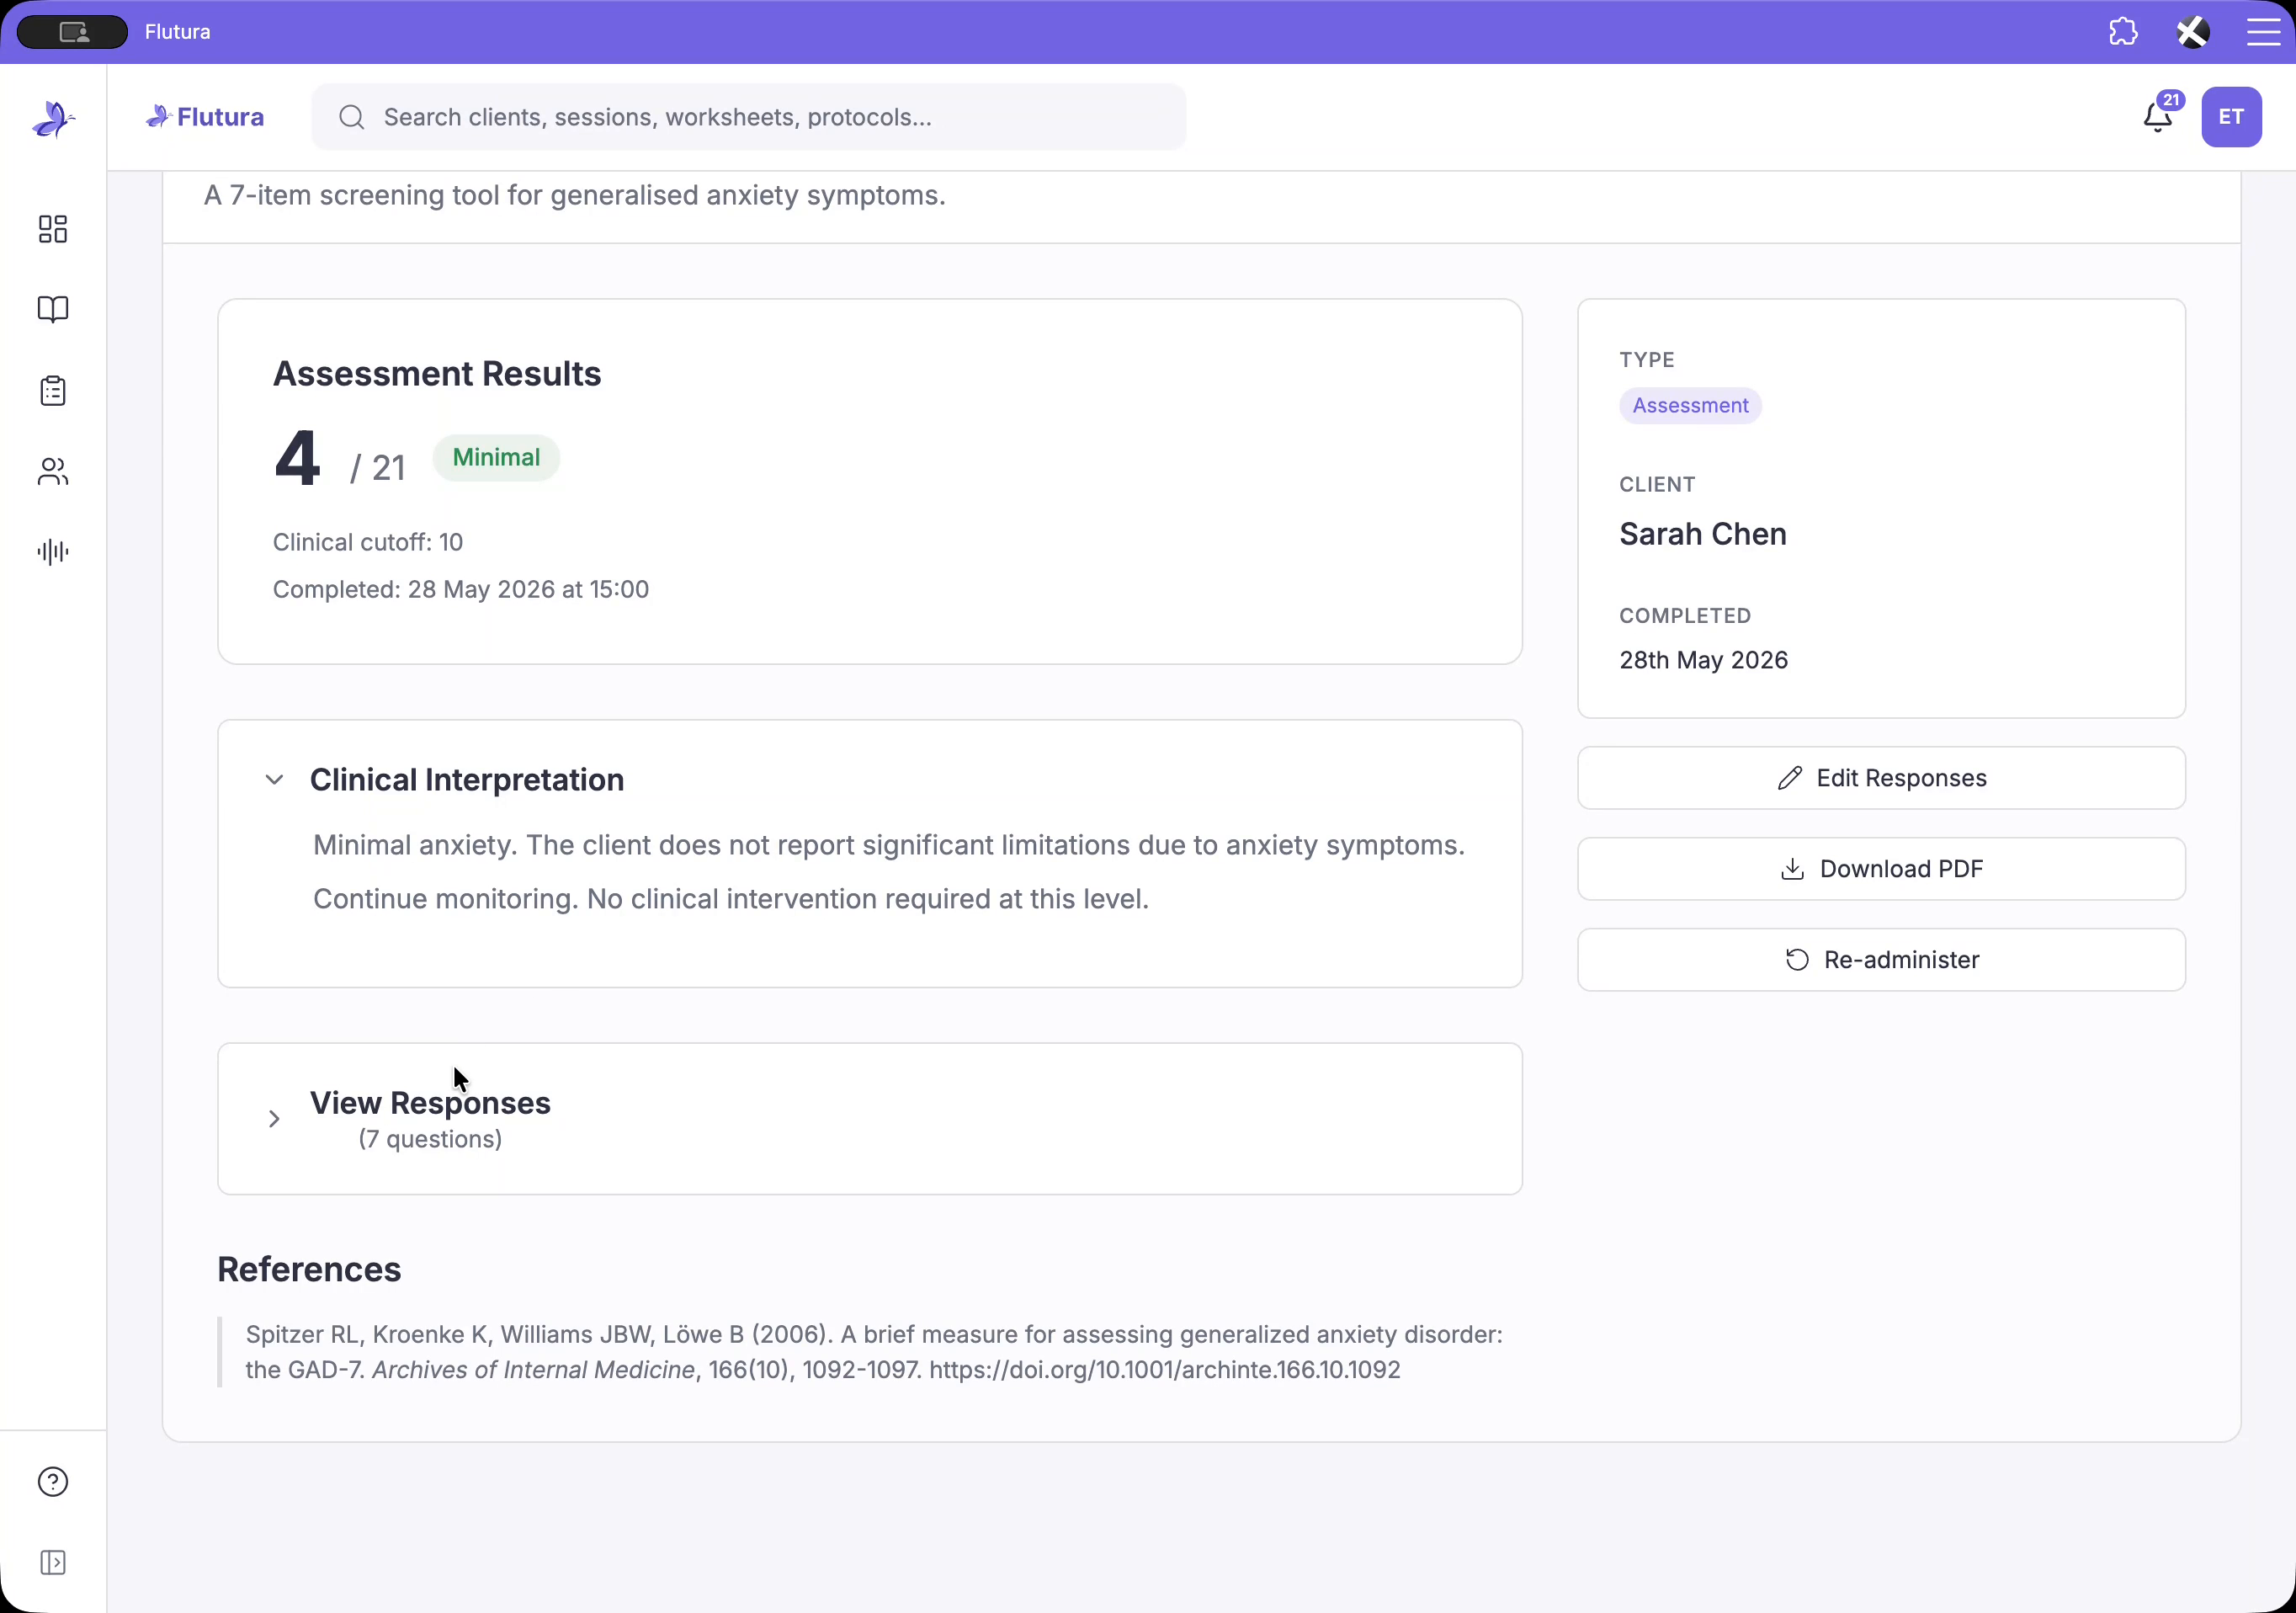
The result screen gives you a detailed breakdown:
The headline score and whether it sits above or below the clinical cutoff
The date and time of completion
An expandable clinical interpretation with a written summary
Expand the narrative section, where available, to read the full interpretive text.
Select View responses to see exactly how your client answered each of the seven items.
If you need to, use the option on the right to edit a specific response, for example to correct a data-entry error.
Download the result as a PDF for your records, or choose Readminister to send a fresh GAD-7, which works the same way as a new assignment.
Used together, the library, one-click assignment, long-term charting, and detailed results let you monitor anxiety symptoms over time with minimal admin, using proven assessments such as the GAD-7 and PHQ-9.
Q: How should I interpret the GAD-7 score?
A: Use the score and severity band to inform your rating, but always read them alongside clinical context and the functional impact your client reports.
Q: Can I correct a client's answer?
A: Yes. Open the result screen and edit the response. Use this only to fix data-entry errors, not to change the client's reported experience.
Q: How far back can I see a client's scores?
A: The trend chart plots every completed GAD-7 for that client, so you can review the full history across treatment.